
The specialised project “Database-supported energy demand recording using the example of an office building”
The specialist project was carried out by a team of three as part of the final examination and as an admission criterion for the written final examinations. The project, which was supervised by our Managing Director Mr Andreas Fritz, among others, started in November 2022 and ended with a presentation day on 2 February 2024.
The aim of the project was to record our company’s total energy consumption, store it in a database for the long term and make this data accessible via a web interface. In addition to the gas, water and electricity consumption of our premises and the electricity generation of the in-house PV system, the data also includes the measured values of a weather station.
In addition to this input, the existing building control system was implemented and additional sensors were installed on the gas meters, an electricity measurement in the PV system supply line and a camera on the water meter. The challenge was to summarise the various system data in a Microsoft SQL database with different interfaces.
The data from the weather station and the gas meters are read from the building control system and written to the database using the “S7-Logger” tool developed by our company.
After analysing the power generation of the PV system using Rogowski coils and a measuring transducer, the recorded data is available as a JSON string via the MQTT protocol. In order to read this data and write it to the database, a separate Python script had to be programmed that reads the data from the measuring transducer cyclically and writes it to the database as SQL commands.
At the start of the project, the development of image processing software was planned for analysing water consumption via a meter reading camera image, but this approach was later discarded for cost reasons. In future, data will be recorded by installing water meters with direct data interfaces.
The data collected from the various resources was visualised using the open source software “Grafana”, which is frequently used for monitoring applications. The diagrams generated in this way via a web interface visualise the data over selective time periods in an optimal way.
The presentation
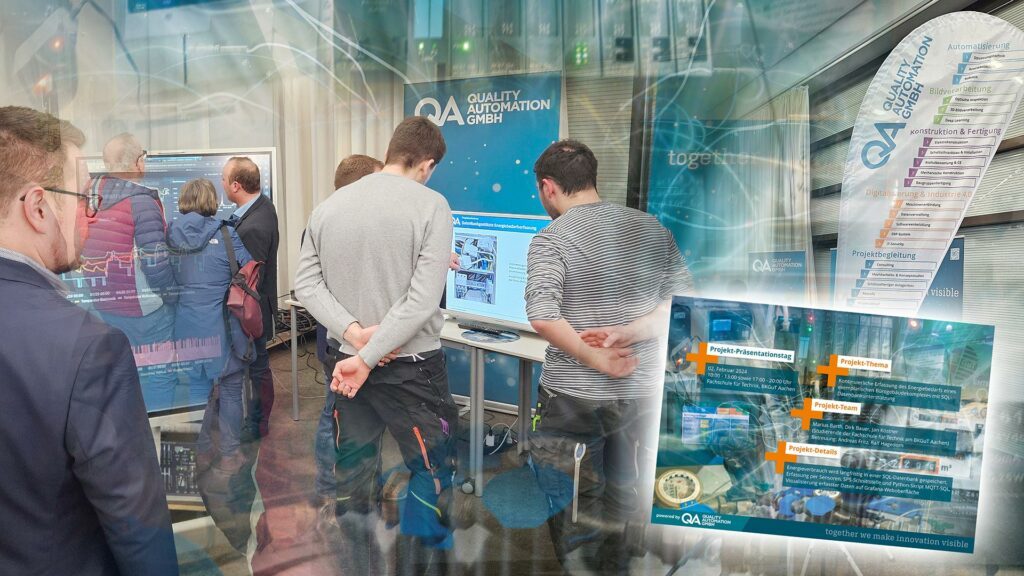
The project conclusion took place on 2 February 2024 as part of a trade fair at the Berufskolleg für Gestaltung und Technik der StädteRegion Aachen, where a total of ten project teams presented their results on exhibition stands created specifically for this purpose. After the internal examinations between 10 a.m. and 1 p.m., numerous interested parties took the opportunity to find out more about the problems and solutions within the individual projects in technical discussions between 5 p.m. and 8 p.m., when the fair was open to the public.
According to Mr Marius Barth, his very successful completion of the specialist project is a great burden for him. After his commitment to QA, school and project work in the past year hardly allowed him to organise his free time, he can now devote more time to his private interests. His conclusion: the project was a valuable experience and brought his project trio closer together, resulting in new friendships.
