Task and objective
In industrial automation, several drives are often controlled simultaneously in order to realize complex motion sequences. Motion controllers are traditionally used for this task, which are independent hardware systems that send instructions to the frequency inverters of the drives. A common application of such controllers is the synchronization of movements of several drives, such as platforms mounted on two axes. If the two drives are not perfectly synchronized, malfunctions such as jamming or damage can occur. In contrast to established hardware controllers, Mitsubishi now relies on a new type of software-based solution that is installed on a Windows PC. This motion control software controls the drives via a network card and communicates with the frequency inverters. The central question of the bachelor thesis was to test whether this software solution is able to synchronize the drives just as reliably as conventional motion controllers and whether it is suitable for setting up parallel kinematics.The test setup and project process
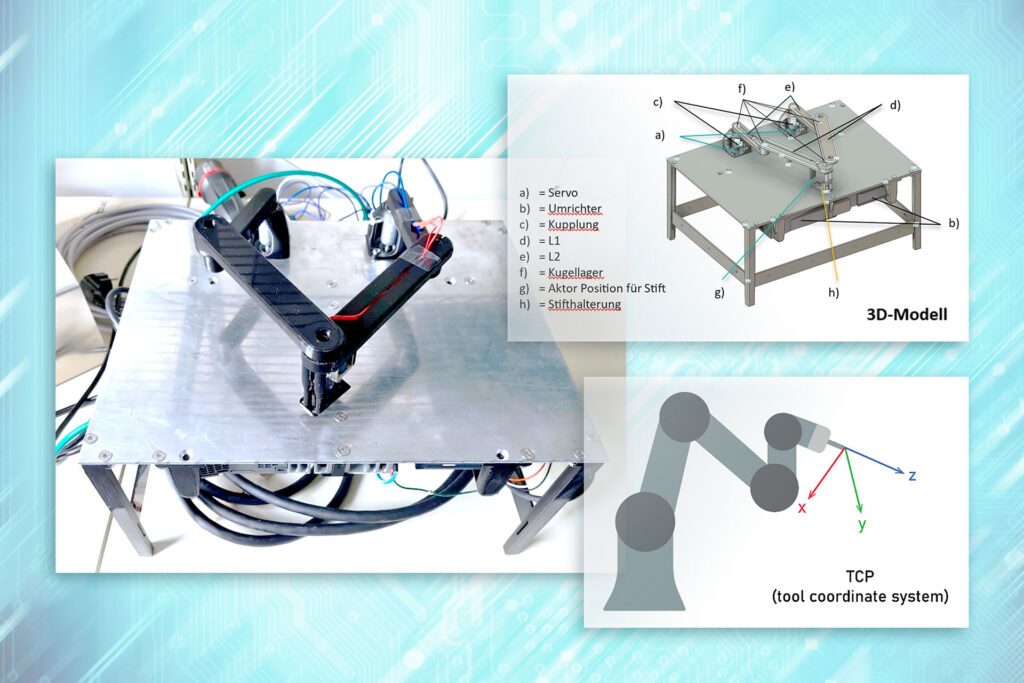
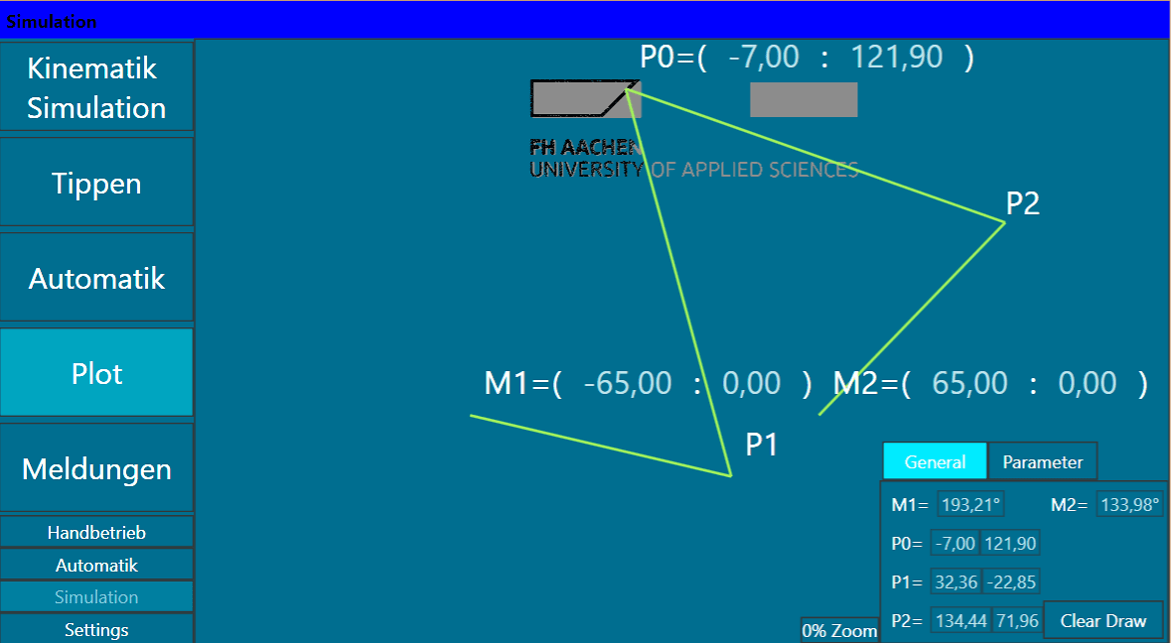
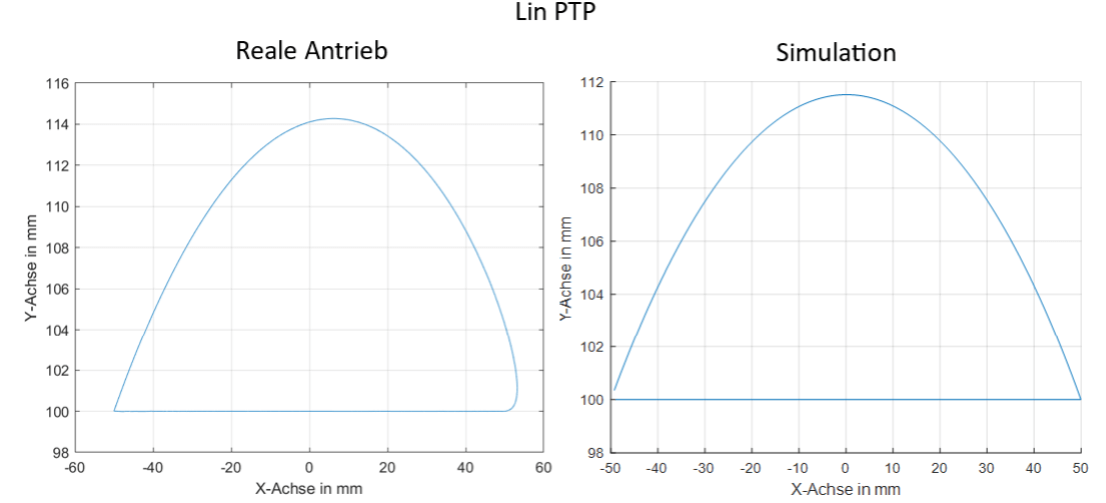
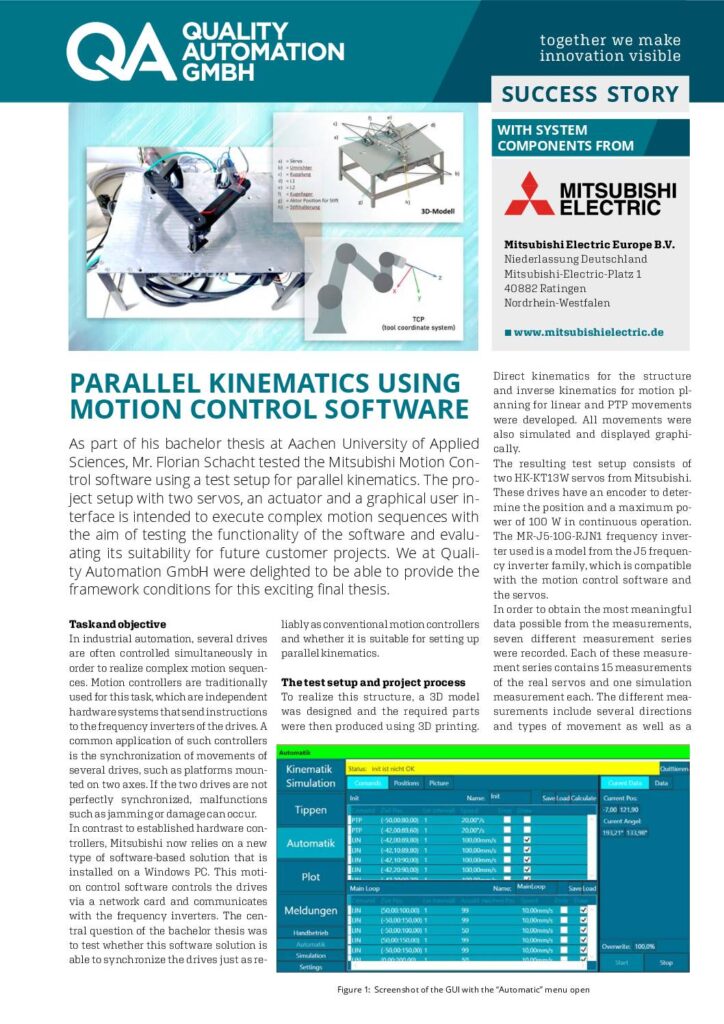
To realize this structure, a 3D model was designed and the required parts were then produced using 3D printing. Direct kinematics for the structure and inverse kinematics for motion planning for linear and PTP movements were developed. All movements were also simulated and displayed graphically. The resulting test setup consists of two HK-KT13W servos from Mitsubishi. These drives have an encoder to determine the position and a maximum power of 100 W in continuous operation. The MR-J5-10G-RJN1 frequency inverter used is a model from the J5 frequency inverter family, which is compatible with the motion control software and the servos. In order to obtain the most meaningful data possible from the measurements, seven different measurement series were recorded. Each of these measurement series contains 15 measurements of the real servos and one simulation measurement each. The different measurements include several directions and types of movement as well as a combination of linear and PTP (Point to Point) movements. The linear PTP movement is shown here as an example of the different measurements. This combined movement is special because it includes both types of movement. First, a linear movement is performed, which worked very reliably in this case. This can be seen in the plot below.The difference between the simulation and the real drive is the acceleration of the drives, which is not mapped in the simulation. With the PTP movement, the real drives are not given a speed value, only a time. This is because the drives are normally moved by the spline movement of the motion control software.
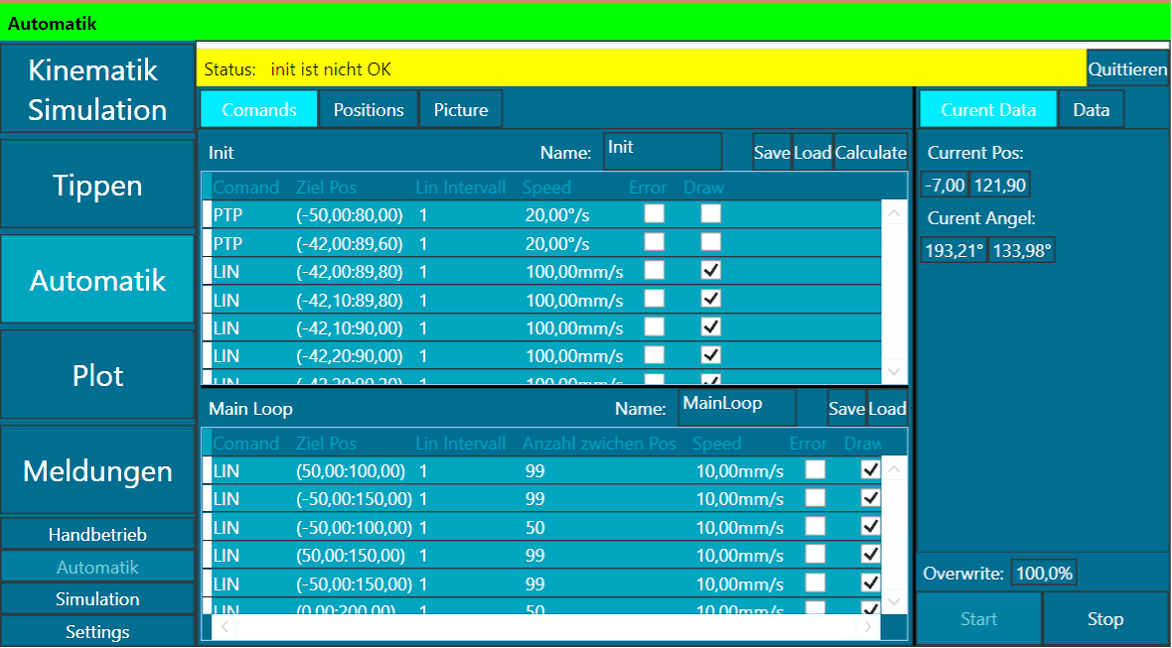
Data processing functions have been implemented in the graphical user interface (GUI) that enable a CSV file and an image to be read in. The CSV file contains all movement commands and can be visualized within the GUI (see Fig. 1). When an image is read in, color filtering takes place first, during which various parameters must be adjusted in order to achieve optimal results. The movement commands are then supplemented using image-processing methods. Once these commands have been generated, a command sequence can be created from the image that enables the image to be plotted.
